What a 1% investment fee can cost over 30 years
Compare 1% and 0.25% annual investment costs, see a 30-year fee-drag example, and learn how to calculate the fees across your own portfolio.

Dan Faber
August 20, 2026·4 min read·Investing, Fees
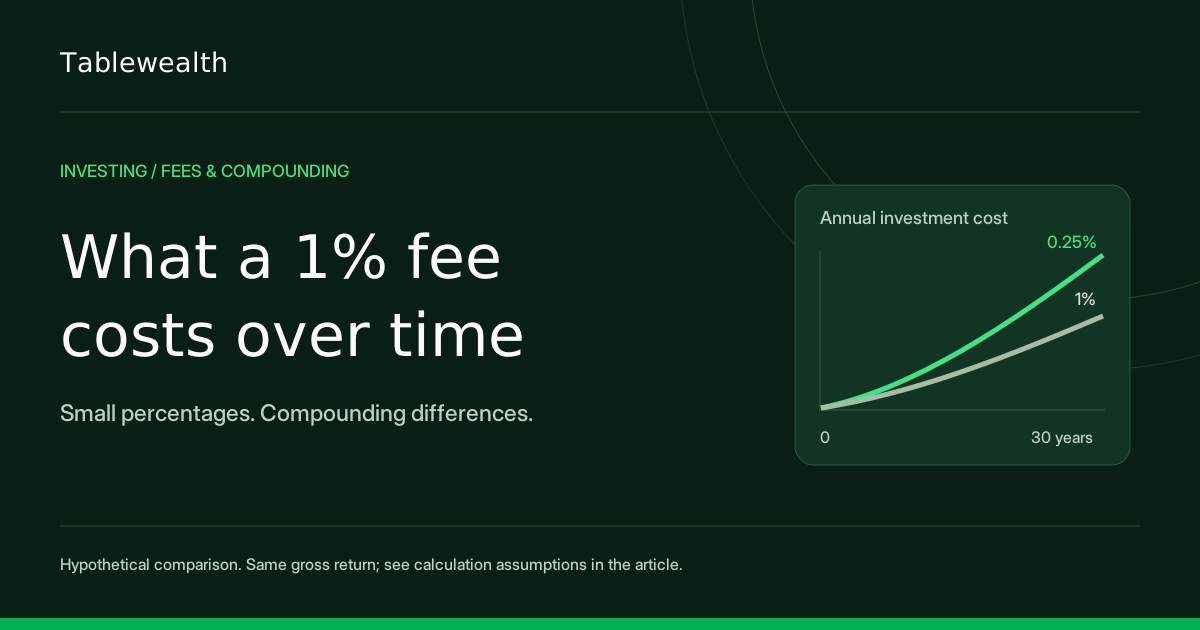
An annual investment fee reduces both the money you keep now and the amount left to compound. In the hypothetical example below, $100,000 growing at 6% before fees ends about $108,000 higher after 30 years with a 0.25% annual fee than with a 1% annual fee. Both portfolios earn the same assumed gross return and receive no additional contributions.
That is a controlled comparison of costs, not a prediction that a particular fund or advisor will deliver the same returns. The useful question is what you pay in total, what you receive for it, and whether an alternative provides comparable investments and services.
A 1% versus 0.25% fee comparison
| Time invested | Value with 0.25% annual fee | Value with 1% annual fee | Difference |
|---|---|---|---|
| 10 years | $174,658 | $161,961 | $12,697 |
| 20 years | $305,053 | $262,314 | $42,739 |
| 30 years | $532,799 | $424,846 | $107,952 |
The formula is starting balance × [(1 + annual gross return) × (1 − annual fee)] raised to the number of years. For the 1% case, that becomes $100,000 × [1.06 × 0.99]^30. This simplified annual charging convention matches the Tablewealth fee calculator; actual funds and advisors may accrue or charge fees on a different schedule.
The SEC’s investor bulletin on fees and expenses explains why ongoing costs reduce the amount left earning returns. The table above uses our own assumptions and calculations, rather than reproducing the SEC’s example.
The expense ratio is only one part of the bill
A fund expense ratio describes annual fund operating expenses as a percentage of assets. It does not necessarily include the separate advisor, account, plan, or transaction costs you also pay. A “no commission” trade does not establish that the investment is free to own.
Use the fund prospectus to find the fee table. The SEC guide to mutual fund and ETF expenses explains the distinction between shareholder charges and operating expenses, including fee waivers. Check whether a quoted net expense ratio depends on a waiver with an expiration date.
| Cost to check | Where to look | Question to resolve |
|---|---|---|
| Fund operating expenses | Prospectus fee table for the exact share class | Which expense ratio currently applies? |
| Advisor fee | Advisory agreement and account statements | Which assets are billed, at what rate or dollar amount? |
| Retirement plan or account charges | Participant disclosures and statements | Are these additional to the investment expenses? |
| Trading or exit costs | Broker schedule and product disclosures | Would changing investments create a one-time cost? |
Weight each fund’s expense ratio by the dollars invested
An ordinary average of expense ratios can be misleading. Multiply each holding’s share of the portfolio by its expense ratio, then add the results. A costly fund holding 10% of your money should not get the same weight as a low-cost fund holding 90%.
That dollar estimate holds balances constant to make the comparison readable. Actual charges can change as assets move, and a tiered advisor fee needs its own calculation. Record each fee’s billing basis rather than adding percentages that apply to different amounts.
Compare the same investment job before deciding to switch
A fee comparison is clearest when the alternatives target similar exposure and provide comparable services. A stock fund and a bond fund have different risks; choosing between them on expense ratio alone does not answer the allocation question. An advisor’s planning work also needs its own evaluation rather than being treated as a fund expense.
- Write down the investment exposure and services you are comparing.
- List recurring costs in both percentages and dollars, plus one-time transition costs.
- Check potential taxes before selling appreciated investments in a taxable account.
- Ask which specific services an advisory fee covers and whether you use them.
- Run more than one return and time-horizon assumption. A single projection should not carry the entire decision.
Start with one account and its actual fee disclosures
Collect the holdings, balances, expense ratios, and any separate advisory or account charges for one investment account. Date the worksheet and identify anything you could not verify. A short list of known costs is more useful than a precise-looking total built from guesses.
Enter your assumptions in the Tablewealth investment fee drag calculator to compare current and alternative costs over time. Use a return assumption before the costs being modeled so you do not subtract those fees twice. The result is an educational scenario, not a forecast or a recommendation to buy or sell an investment.
Related calculators