What is a good net worth by age?
See median and average net worth by age using Federal Reserve Survey of Consumer Finances data, learn what counts in net worth, and compare your own number with a free calculator.

Dan Faber
June 13, 2026·8 min read·Finance, Benchmarks

A good net worth by age is usually best measured against the median net worth for your age group, then interpreted alongside your household size, housing situation, debt load, income, and goals. The median is the middle household: half of households in the group have more, and half have less.
Median net worth is usually the most useful starting benchmark because the average is pulled up by a small number of very wealthy households. Average net worth is still useful, but it answers a different question: how much wealth exists in the group divided across households, not what a typical household looks like.
The benchmark numbers below are based on the Federal Reserve Survey of Consumer Finances, the major triennial survey the Federal Reserve uses to measure household balance sheets in the United States. The latest public SCF release is 2022, so the table is shown in 2022 dollars.
Good net worth by age: the quick answer
Using the 2022 Survey of Consumer Finances, the median household net worth was about $39,000 for households under 35, $135,000 for ages 35 to 44, $247,000 for ages 45 to 54, $364,000 for ages 55 to 64, $410,000 for ages 65 to 74, and $335,000 for ages 75 and older.
Those are household numbers, not individual targets. A 34-year-old single renter, a 34-year-old couple with home equity, and a 34-year-old parent supporting dependents may all sit in the same age band while having very different financial obligations.
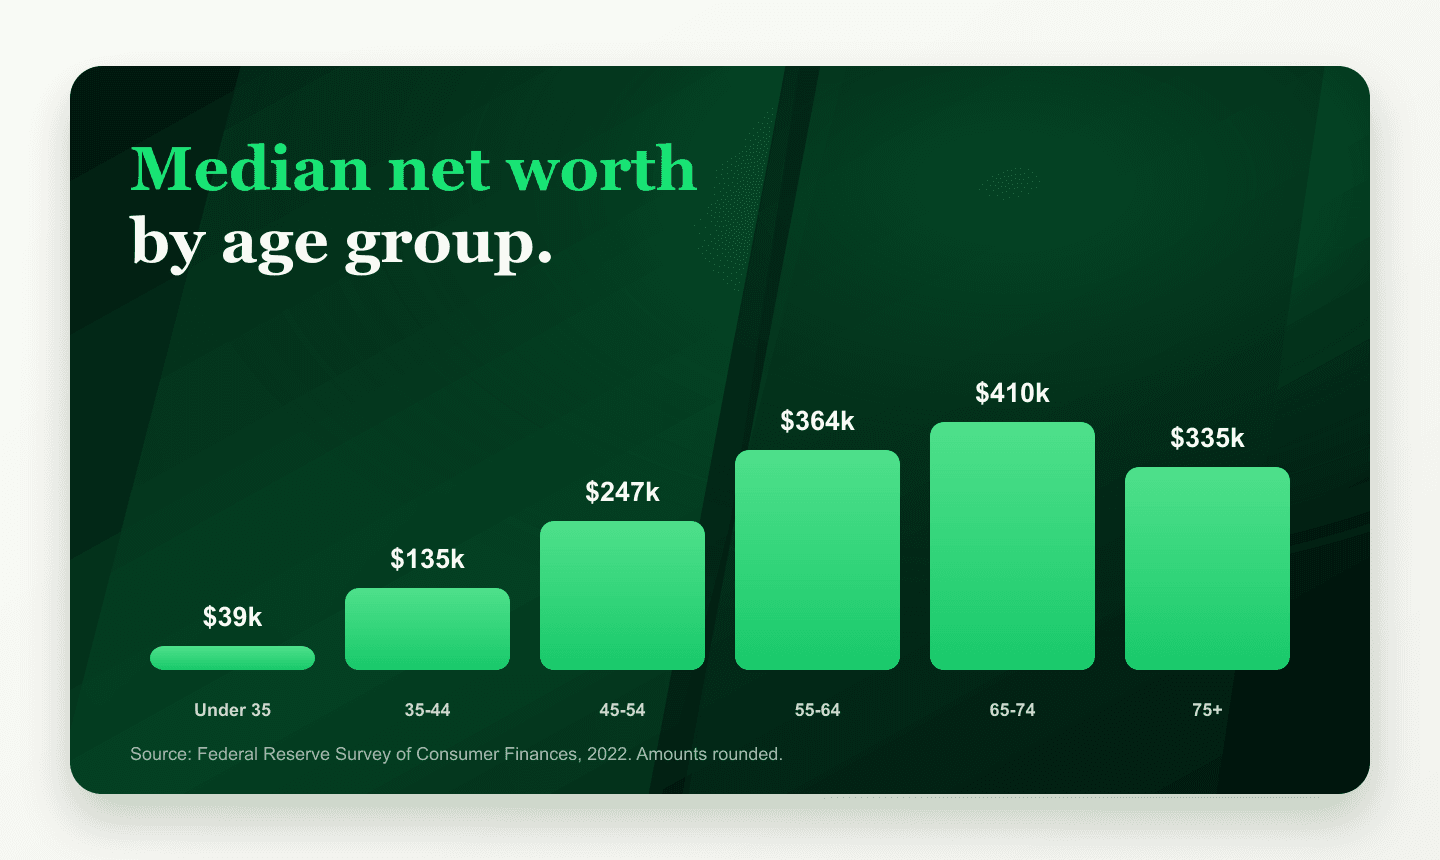
Net worth by age benchmarks
| Age group | Median net worth | Average net worth |
|---|---|---|
| Under 35 | $39,040 | $183,376 |
| 35-44 | $135,300 | $548,072 |
| 45-54 | $246,700 | $971,274 |
| 55-64 | $364,270 | $1,564,072 |
| 65-74 | $410,000 | $1,780,715 |
| 75+ | $334,700 | $1,620,104 |
If you want one number to compare yourself against, use the median. If you want to understand the full spread of wealth, look at the average too. The gap between the two is large in every age group because wealth is not evenly distributed.
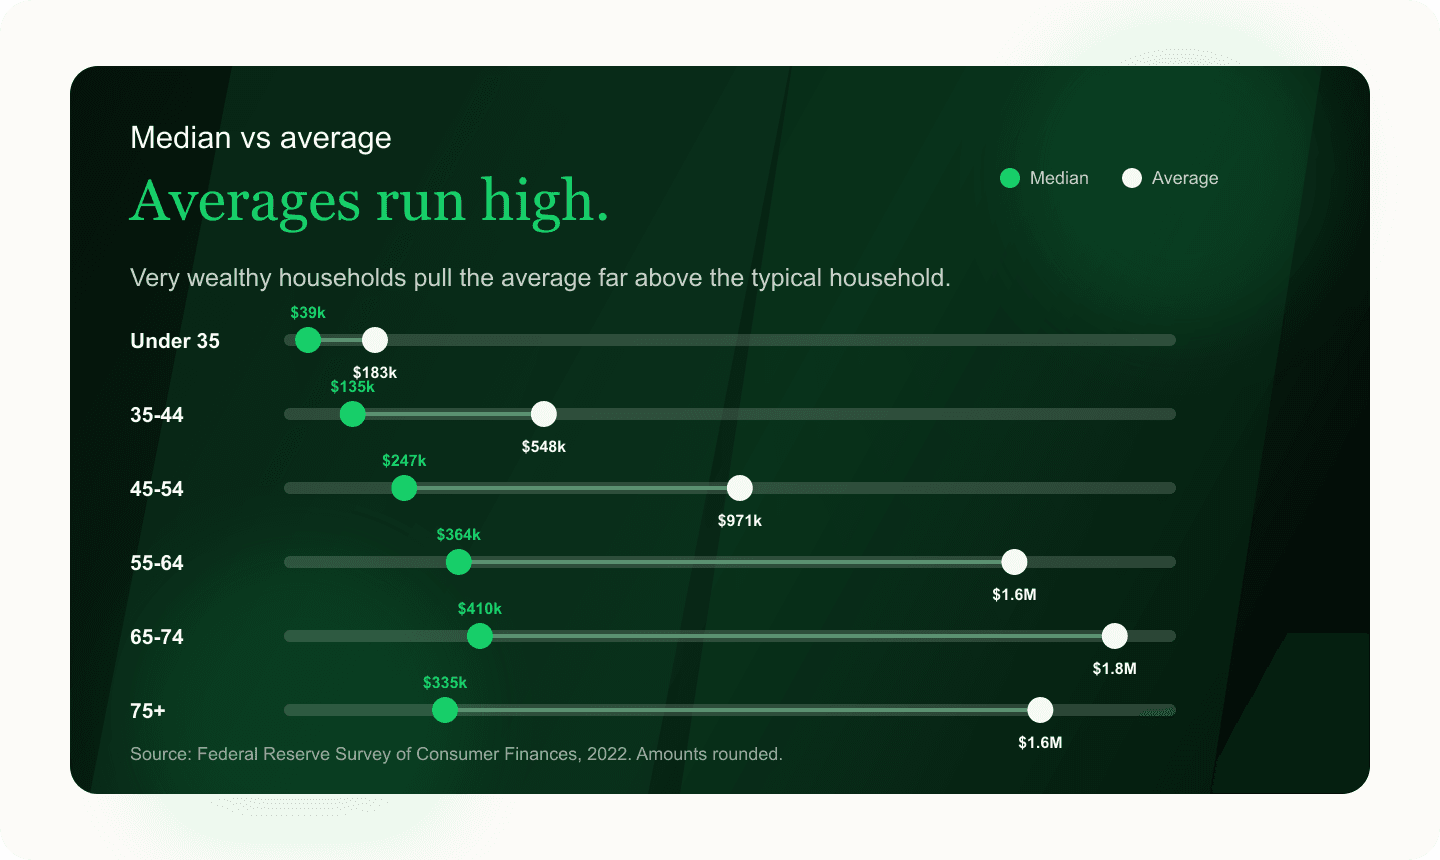
How to read net worth benchmarks
A benchmark is a reference point, not a grade. Being below the median may mean you are earlier in a homeownership cycle, paying down student debt, building a business, supporting family, or living in a high-cost area. Being above the median may reflect strong saving, home appreciation, investment gains, inheritance, business ownership, or simply being later in your compounding journey.
Age bands also hide important differences inside the group. Someone who just turned 35 is compared with someone about to turn 45. Someone who just retired may be grouped with someone still working. That is why the calculator is more useful than the table alone: it gives you a direct comparison for your current age and net worth instead of asking you to mentally interpolate.
"Use the benchmark to ask better questions, not to decide whether your financial life is good or bad."
What counts as net worth?
Net worth is assets minus liabilities. Assets can include cash, checking and savings accounts, taxable brokerage accounts, retirement accounts, home equity, vehicles, business equity, private investments, and other property. Liabilities can include mortgages, student loans, auto loans, credit card balances, personal loans, margin debt, and other debts.
For a household benchmark, the cleanest method is to count household assets and subtract household liabilities once. Avoid double counting investment cash inside a brokerage account, home equity and home value separately, or joint accounts once for each person.
Median net worth vs average net worth
Median and average are both correct, but they tell different stories. Median net worth is better for understanding the typical household. Average net worth is better for understanding total wealth concentration in an age group.
For example, households ages 45 to 54 had a median net worth of about $247,000 in the 2022 SCF, but an average net worth of about $971,000. That does not mean most households in that age group are close to $1 million. It means the top of the distribution is large enough to pull the average far above the midpoint.
Why net worth changes with age
Net worth usually rises with age because households have had more time to save, pay down debt, buy assets, and benefit from compounding. The age pattern is also shaped by home equity, retirement account balances, investment returns, and whether a household is still accumulating or already spending down assets.
The 65 to 74 age group has the highest median in the 2022 table. The 75 and older group is lower on median net worth, which can reflect retirement withdrawals, health expenses, gifts to family, changes in housing, and the normal spend-down of accumulated assets.
What these numbers do not tell you
The SCF is one of the best public sources for household wealth data, but it is still a survey. The numbers are estimates, they are released with a lag, and the latest public release currently reflects 2022 dollars rather than today's asset prices or inflation-adjusted conditions.
The table also does not adjust for location, household composition, income, education, race, homeownership, family help, disability, business ownership, or whether debt was used to buy an appreciating asset. Those factors can materially change what a healthy balance sheet looks like.
Get a free net worth benchmark comparison
The table above is useful, but your age group is only the starting point. Use the free Tablewealth net worth benchmark calculator to compare your net worth by age and see the benchmark that matches your situation.
The calculator gives you a fast comparison without connecting accounts. It uses the same SCF benchmark dataset, then lets you see where your number falls relative to the age-based household distribution.
If you want to keep tracking your net worth after that, Tablewealth can help you connect accounts, add manual assets and liabilities, build a dashboard, or sync the data into a spreadsheet.
Methodology and source notes
The benchmark table uses 2022 household net worth estimates from the Federal Reserve Survey of Consumer Finances. Net worth is defined as total assets minus total liabilities. Values are rounded for readability and shown in nominal 2022 dollars.
Tablewealth is not a registered investment adviser, broker-dealer, tax adviser, or legal adviser. This article and calculator are educational tools for understanding household balance sheet benchmarks, not financial, investment, tax, accounting, or legal advice.
Related calculators